More Detail Please!
When doing underwater noise propagation modelling - how much information should we include in our models? The answer is probably "as much as we can".I this post I'll follow the changes in transmission loss (and therefore impact) as we add more information to the model.
I need to stress that this is only a few examples and that real-world scenarios are more complex and we (unfortunately) cannot generalise these results to all scenarios.
I ran 12 scenarios (all 16 Hz -16 kHz):
- Three different bathymetries, all with max range = 500 meters.
- Flat, 100 meters deep
- Rough, 100 meters deep (± 5 meters at random)
- Sinusoidal, 100 meters deep (± 10 meters)
- Four different levels of model complexity
- Bathymetry only, semi-spherical transmission loss (log-type), constant sound speed profile, sand sediment only.
- Bathymetry only, dBSeaPE and dBSeaRay solvers, constant sound speed profile, sand sediment only.
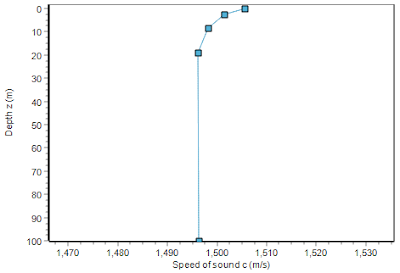
- Bathymetry only, dBSeaPE and dBSeaRay solvers, curved sound speed profile (think summer), sand sediment only.
- Bathymetry only, dBSeaPE and dBSeaRay solvers, curved sound speed profile (think summer), layered sediment: Sand, gravel, rock.
 |
| Figure 1. Sound speed profile |
For this small profile of 500 meters the minimal transmission loss (max level) is comparable to a 15log(range) transmission loss, with some dependence on bathymetry (solid lines) and strong dependence on sediment composition (green vs red lines).
 |
| Figure 4. 15log(range) has been subtracted from all levels to facilitate comparison. (Legend is coded as "Bathymetry type", "Solvers","Sound speed profile shape", Sediment type") |
When looking at the perhaps more relevant median level over all depths (median transmission loss, Figure 5 & 6 below), the transmission loss is better described by a 10log(range) loss (cylindrical loss). This is closer to what we would expect for a waveguide with little loss at the boundaries.
We still see a large difference within 150 m from the source, while further away the differences disappear, due to energy in the sediment re-entering the water column.
 | ||
| Figure 6. 10log(range) has been subtracted from all levels to facilitate comparison. (Legend is coded as "Bathymetry type", "Solvers","Sound speed profile shape", Sediment type") |
The general trend seems to be that we see a greater transmission loss when adding this additional information to the model - should we be surprised? - No:
- The sound speed profile i chose refracts energy away from the surface (near loss-less reflection) and towards the sediment (lossy reflections & penetration).
- Non-flat bathymetry increases the scattering and likely also the boundary interactions.
The next question is, what happens at greater distances?
Expanding our range to 5000 meters we start to see the expected effects (Figure 7) of the harder sediment in the last case (sand-gravel-rock versus just sand). We can also see that assuming a perfectly flat bathymetry is likely to underestimate transmission loss when a harder sediment is in place.Looking at the levels (median over depth) versus range we see a clear picture, where a harder sediment (red lines) leads to lower long-range transmission losses and smoother seabed (solid lines, top line in Figure 8 & 9) leads to lower transmission loss.
While the short range transmission loss (Figure 6) followed a 10log(range) transmission loss over the first 500 meters, we see a closer fit to 15log(range) when extending the range to 5000 meters (Figure 9).
For this rather shallow (100 m) waveguide we see that at short ranges both the sediment and the sound speed profile is important for the transmission loss, while at longer ranges the transmission loss is governed more by the shape of the seabed and the sediment type, with the sound speed profile playing less of a role. The difference is > 3dB when including the complex sediment, and an additional > 3dB between seabed shapes. For e.g. impact/risk ranges this translates to roughly 2-4 times the range (4-16 times the area!)


Comments
Post a Comment